Statistics with R

Gene set comparison and enrichment analysis

Jacques van Helden & Olivier Sand

2020-06-03

Two main approches

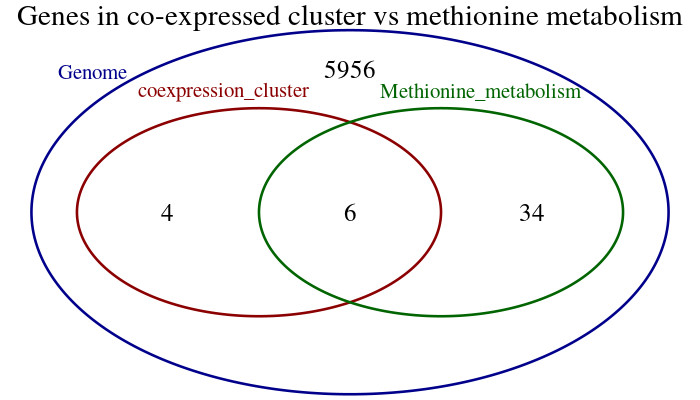
Gene set comparison (over-representation of the intersection)

Venn diagram

The hypergeometric test

Symbol Meaning
\(g = 6000\) number of genes
\(m = 40\) genes involved in methionine metabolism
\(n = 5960\) genes not involved in methionine metabolism
\(k = 10\) number of genes in the cluster
\(x = 6\) number of methionine genes in the cluster
Symbol Meaning Formula
\(C_1\) choose 10 distinct genes among 6000 \(C_1 = C_{m+n}^{k} = \frac{6000!}{10!5990!} = 1.65e^{31}\)
\(C_2\) choose 6 distinct genes among the 40 involved in methionine \(C_2 = C_{m}^{x} = \frac{40!}{6!34!} = 3.8e^{6}\)
\(C_3\) choose 4 genes among the 5960 which are not involved in methionine \(C_3 = C_{n}^{k-x} = \frac{5960!}{4!5956!} = 5.2e^{13}\)
\(C_4\) choose 6 methionine and 4 non-methionine genes \(C_4 = C2 \cdot C3 = C_{m}^{x}C_{n}^{k-x} = 2.0e^{20}\)

The hypergeometric test - probabilities

ORA - precautions to take

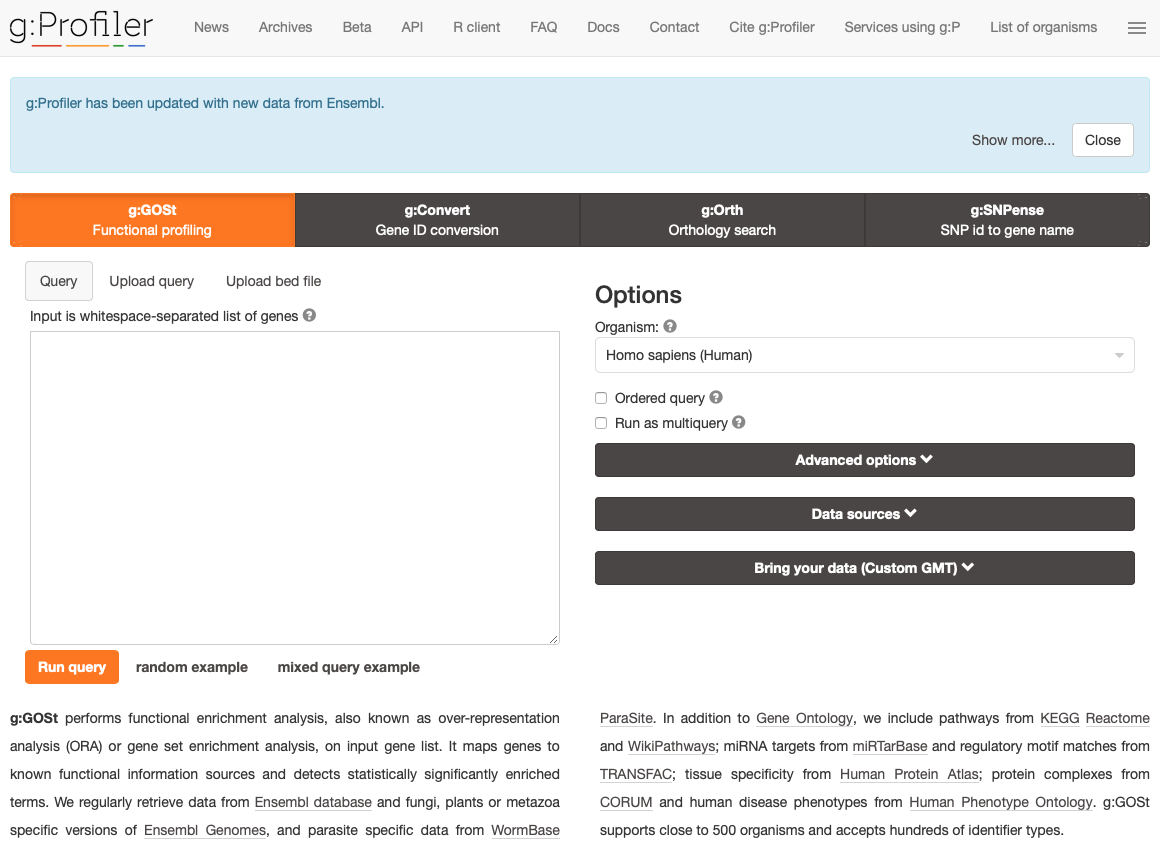
Practical - Annotating a group of differentially expressed genes (DEG)

Practical - DEG

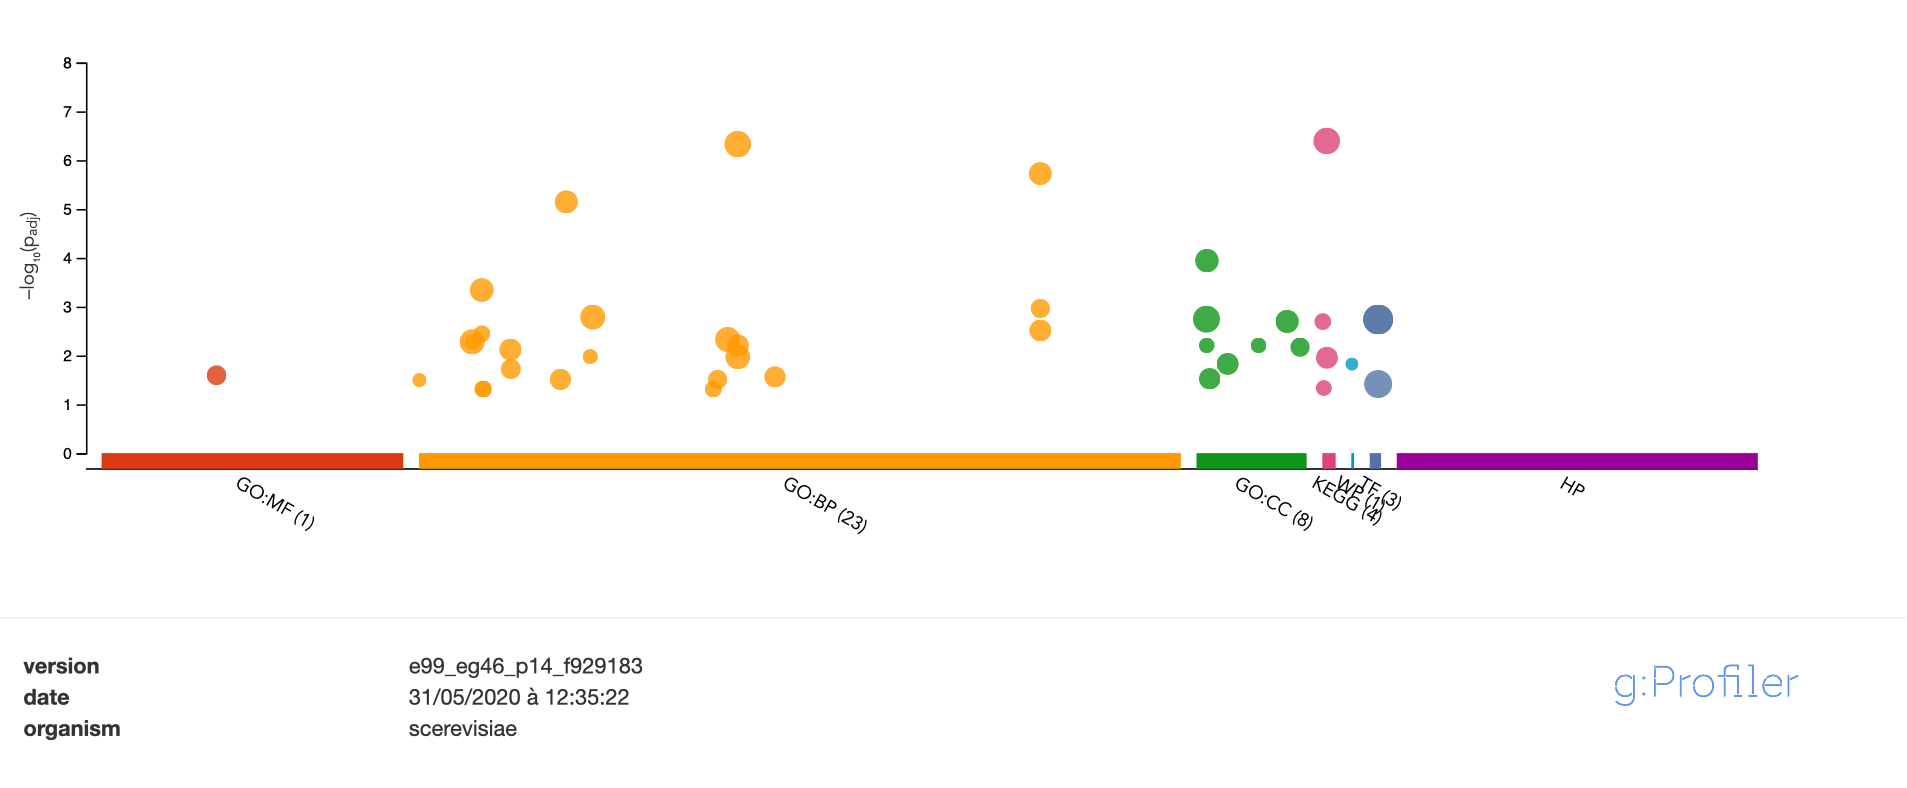
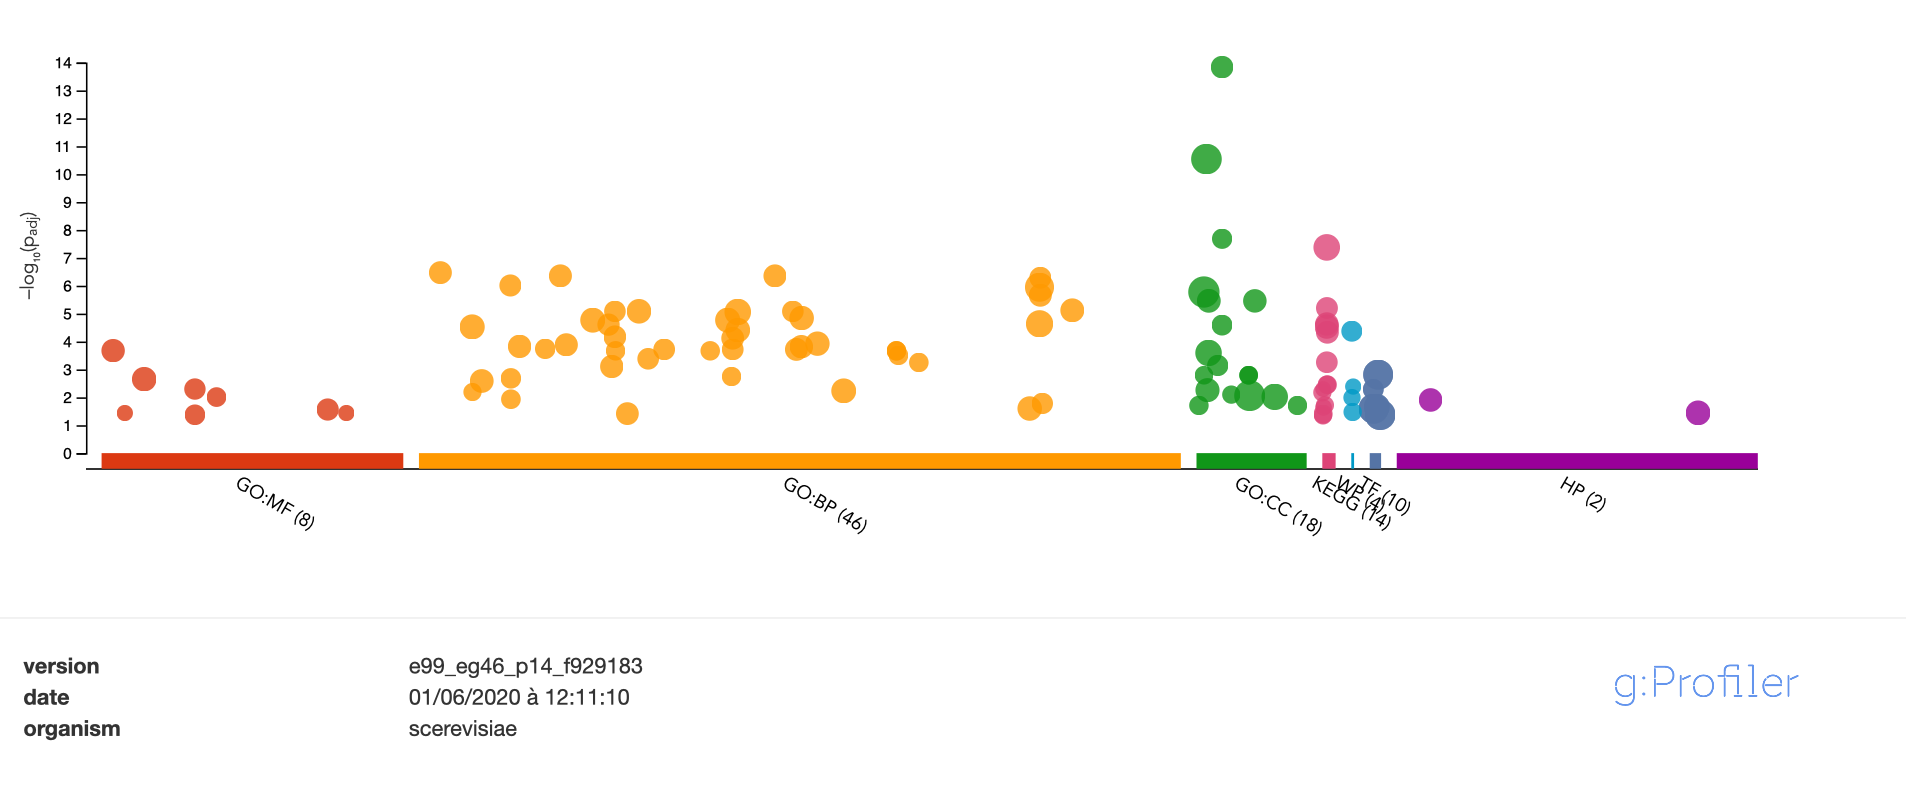
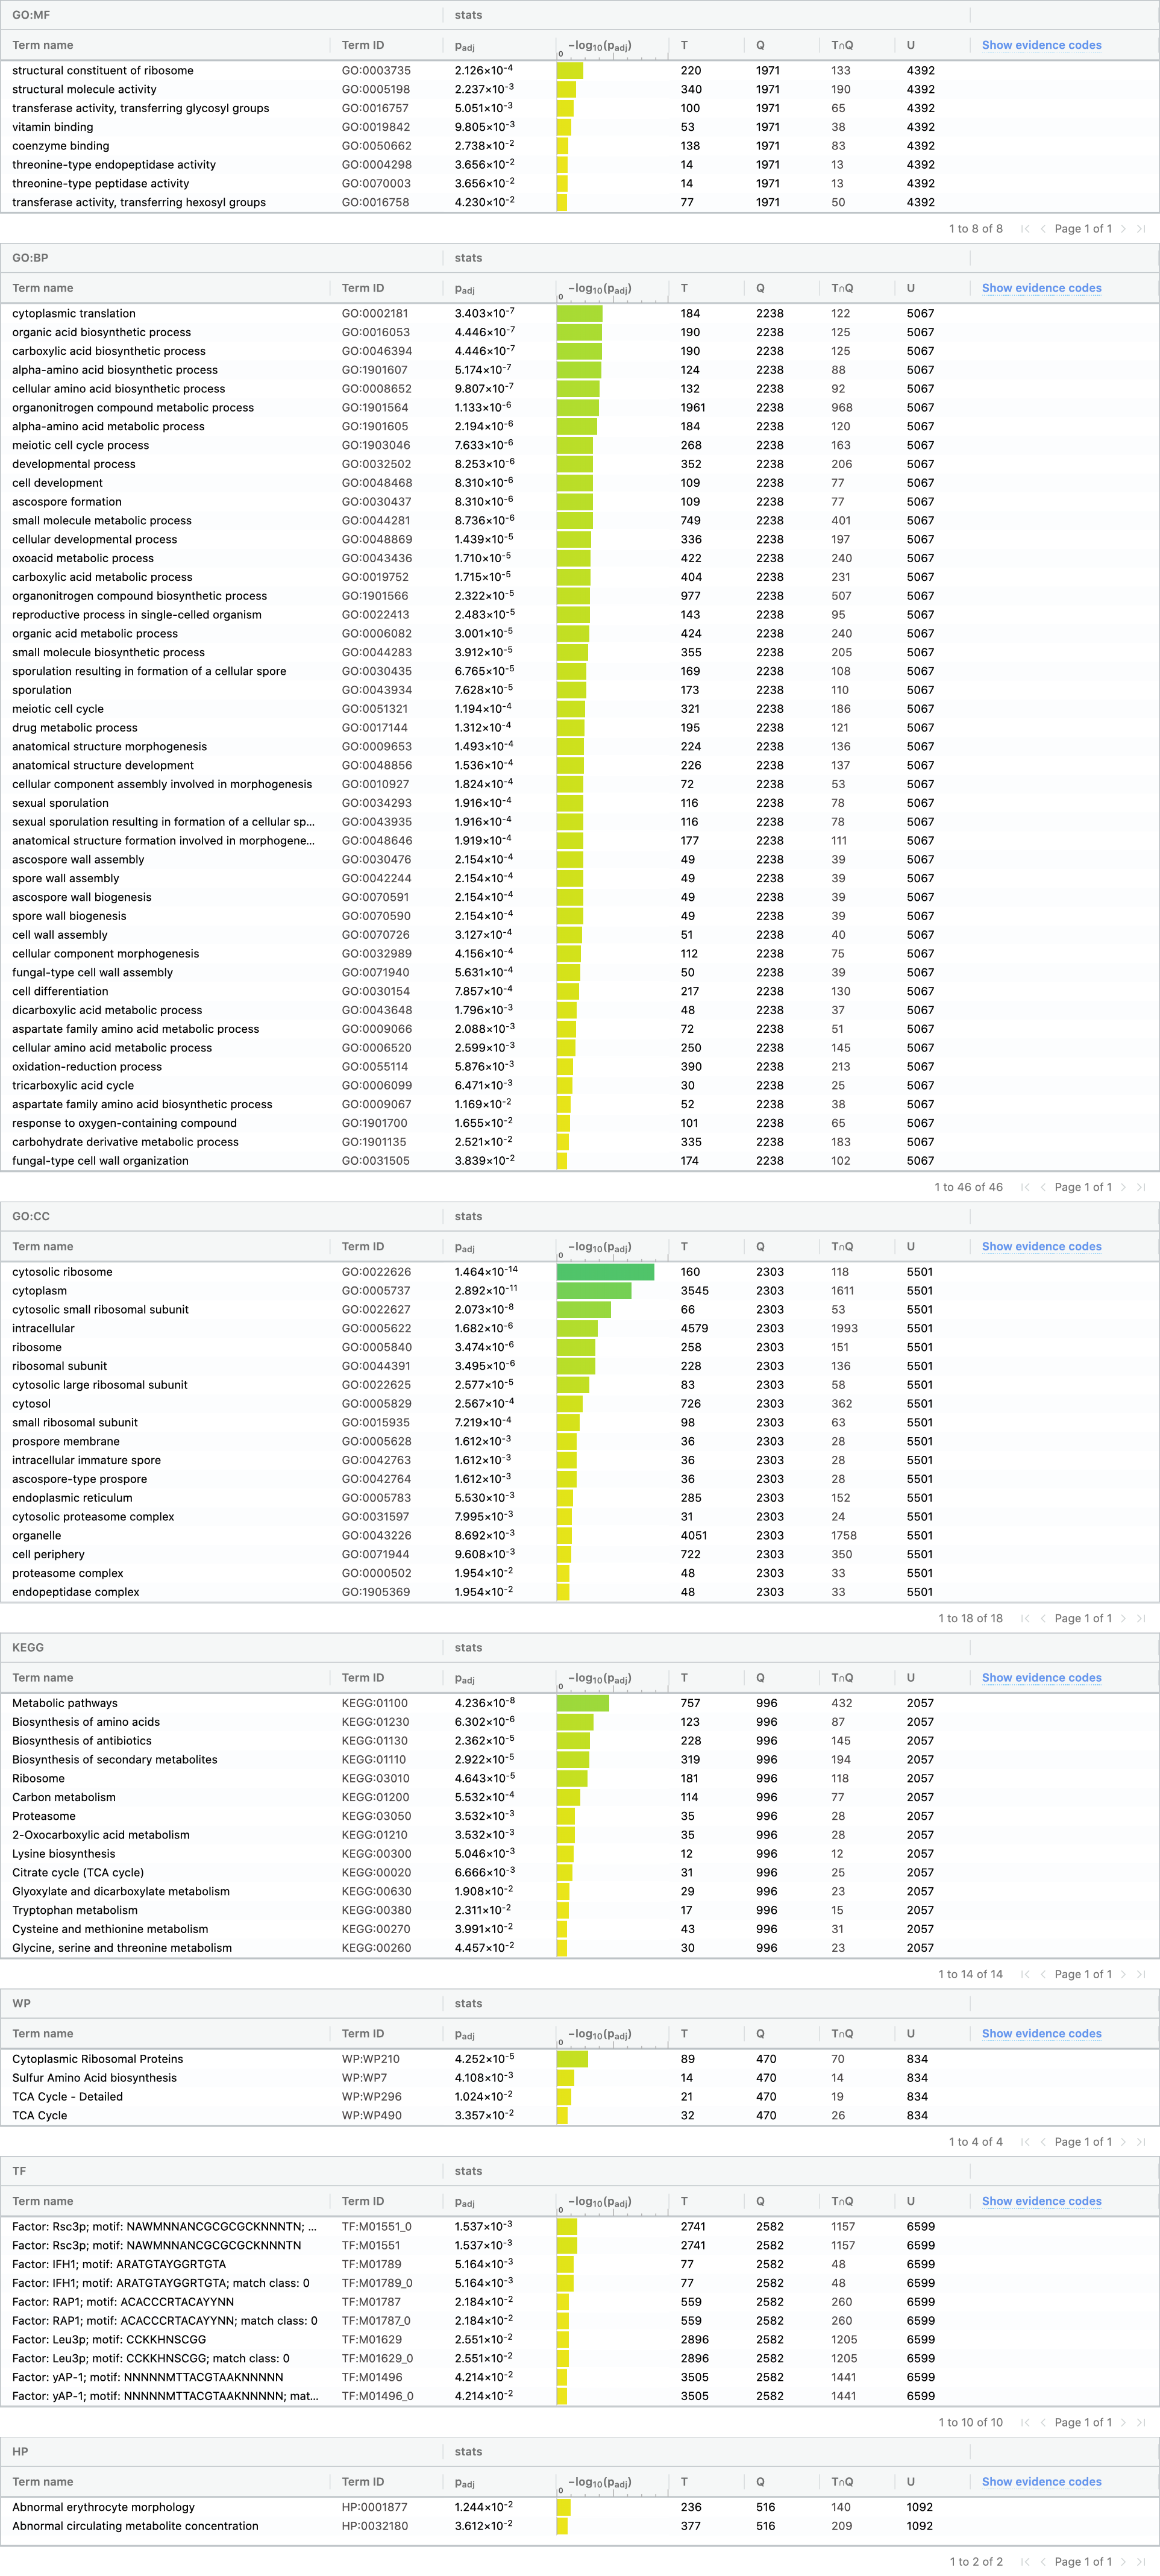
Practical - Results

Practical - Results

Practical - detailled results t0

Practical - detailled results t4

gProfiler in R

Gene Set Enrichment Analysis

GSEA

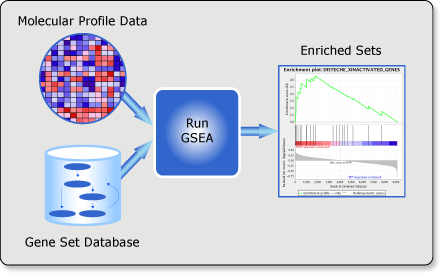
GSEA principle

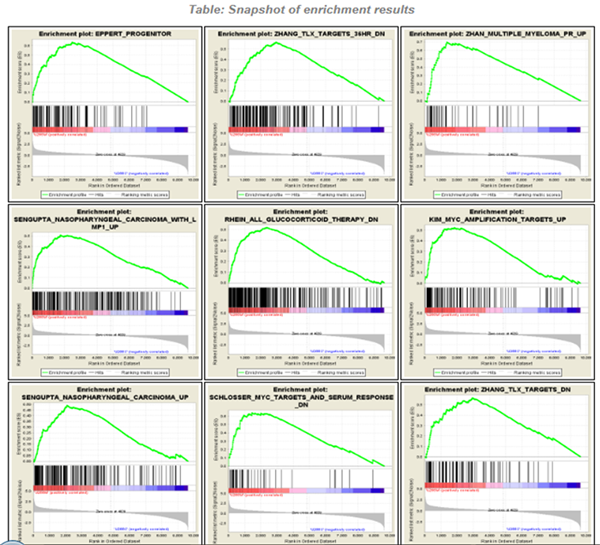
GSEA screenshot